
In this article, I briefly describe the process of electrophoresis and how protein purification is related to specific activity.
Separation of Proteins and Chromatography
The cells contain thousands of varieties of proteins that can be separated based on size, charge, or binding properties. A protein can be studied in detail only when it can be separated from other proteins in its pure form.
Different types of chromatography methods are used to purify proteins, among which column chromatography is the most powerful technique for fractionating proteins. Ion-exchange chromatography applies an ion-exchange mechanism to separate proteins based on their respective charges. Size-exclusion chromatography, also known as gel filtration chromatography, separates proteins based on their size. Affinity chromatography separates proteins based on their binding properties.
Electrophoresis
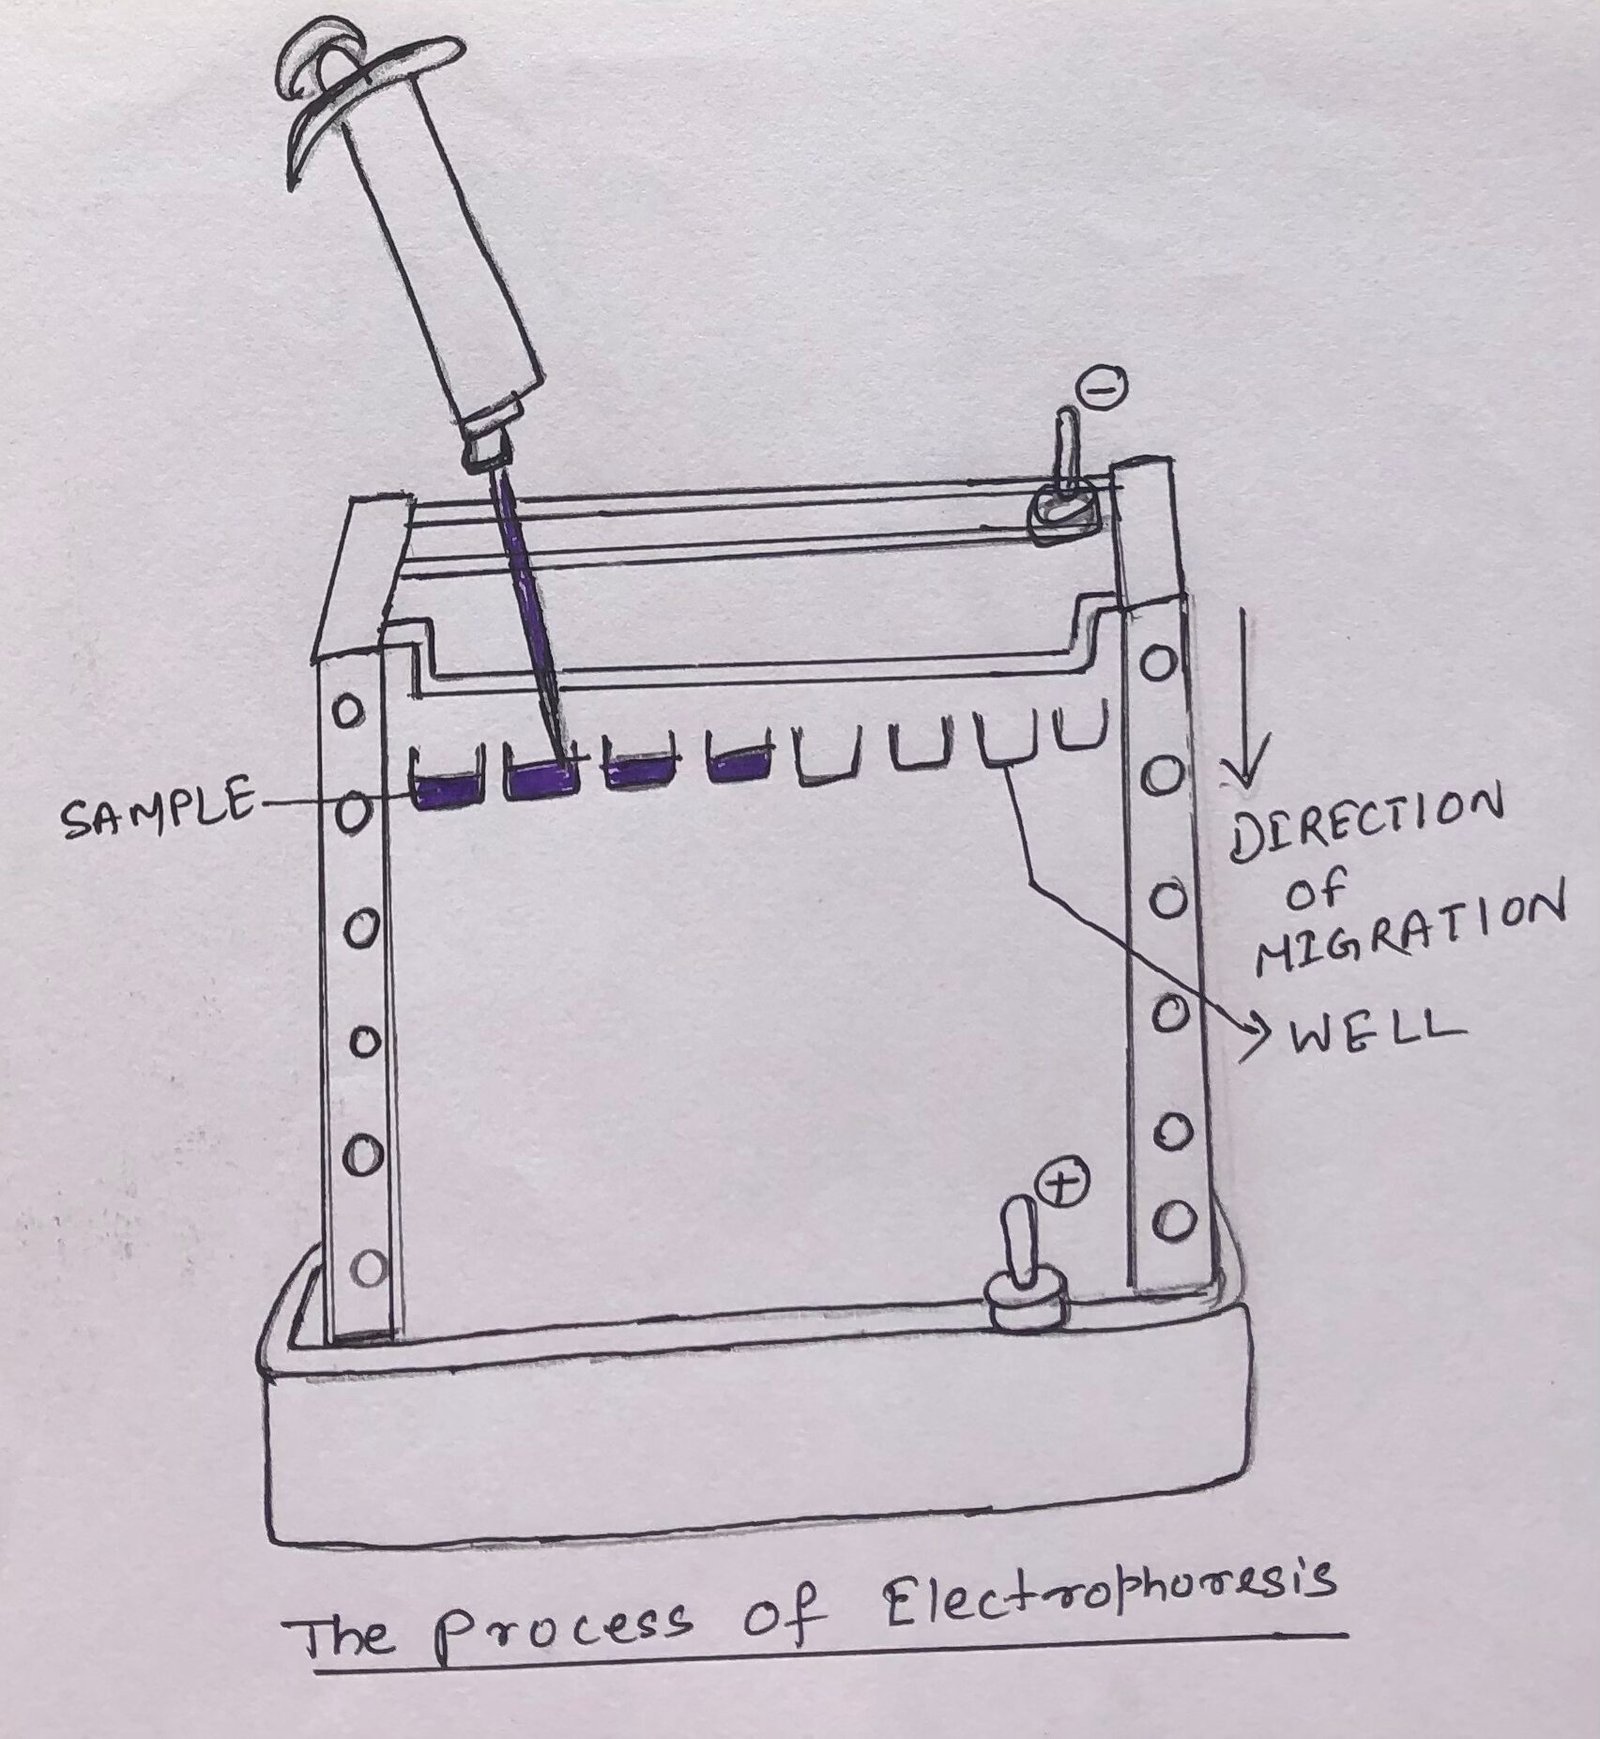
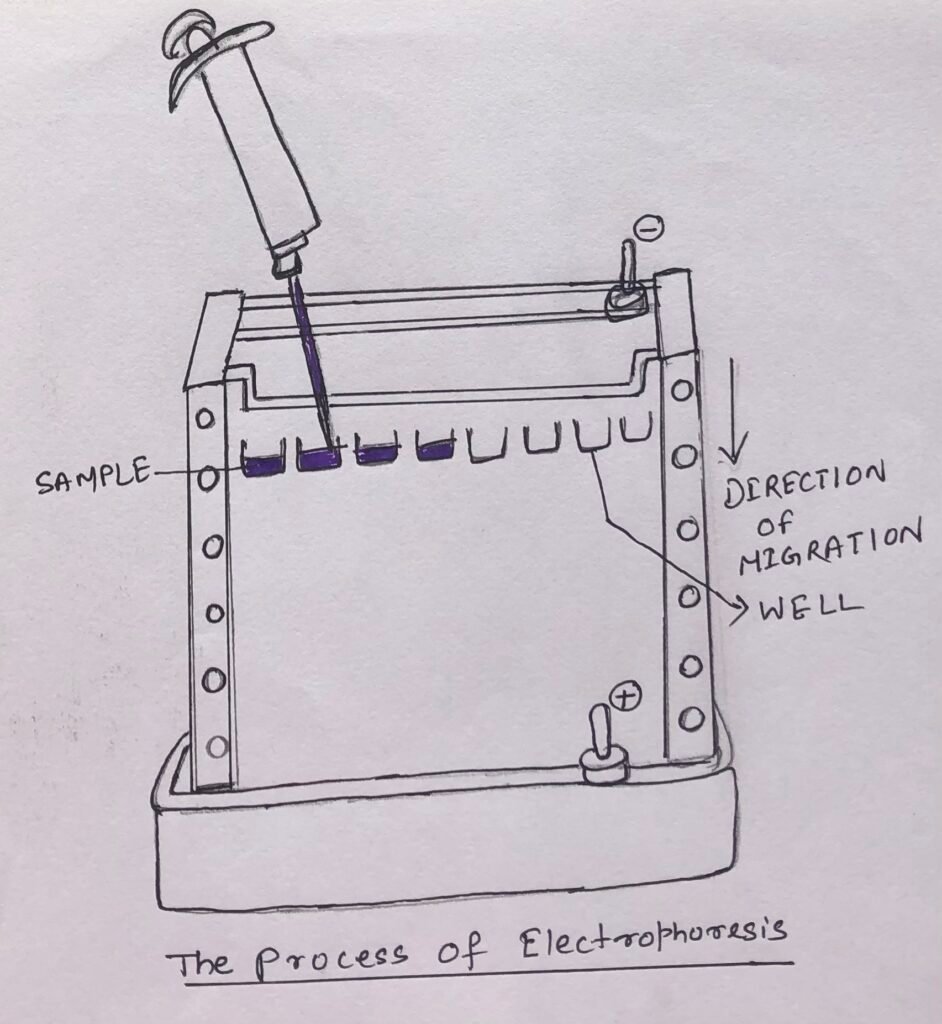
Electrophoresis is a process where charged proteins can be separated based on their migration in an electric field. (Figure 1).
Electrophoresis is a tedious method of separating proteins in comparison to the chromatographic methods. It often has adverse effects on the structure and function of proteins.
However, it is an extremely important method to analyze proteins. In this method of separation, proteins can be visualized while separated. This quickly allows the researcher to estimate different proteins in a mixture or to analyze the purity of a particular protein.
Electrophoresis is also used to determine the isoelectric point and approximate molecular weight of a protein.
Gel Electrophoresis
Gel electrophoresis of proteins is a method of analyzing the proteins in a fluid or an extract. It can be done with or without a supporting medium. However, normally, it is carried out in agarose or polyacrylamide gels.
The movement of proteins in a polyacrylamide gel slows down in proportion to their charge-to-mass ratio. In electrophoresis, electrical potential acts as a moving force behind the macromolecule.
The movement of a protein in an electrophoretic gel is a function of its size and shape. The electrophoretic mobility (µ) of a molecule can be determined by the ratio of its velocity to the electrical potential.
The electrophoretic mobility also depends on the shape of the protein molecule. It can be calculated by the ratio of the net charge to the frictional coefficient f, which is a part of the protein’s shape. So, symbolically, the relationship is
µ = V/E = Z/f, where
µ is the electrophoretic mobility of the molecule
V is the velocity of the molecule
E is the electrical potential
Z is the net charge of the molecule
f is the frictional coefficient
SDS-Polyacrylamide Gel Electrophoresis
There are variations of gel electrophoresis, which include SDS-PAGE, affinity electrophoresis, immuno-electrophoresis, capillary electrophoresis, etc. The SDS-PAGE is the commonly used method for the separation of proteins. In this process, the detergent sodium dodecyl sulfate (SDS) is used to denature native proteins into unfolded individual polypeptides.
In SDS-PAGE, the polyacrylamide gel is sandwiched in a slab gel between two glass plates. SDS-PAGE electrophoresis separates proteins based on mass.
One gram of protein binds near about 1.4 grams of SDS. The binding of SDS puts up a huge negative charge, thus making the intrinsic charge of the protein insignificant. So, SDS acts as a surfactant, concealing the protein’s intrinsic charge and conferring on each protein a similar charge-to-mass ratio.
The SDS-bound proteins assume a rod-like shape because the binding of SDS partially unfolds proteins. When a constant electric field is applied, each protein, according to its charge, migrates at a different speed towards the anode.
After the process of electrophoresis, the proteins can be seen by adding a dye known as Coomassie blue, which only binds with proteins and not with the gel. After each new fractionation step, the number of protein bands visible in the gel decreases.
Isoelectric Focusing
To determine the isoelectric point of a protein, a procedure known as isoelectric focusing is used. The process involves the addition of a mixture of low molecular weight organic acids and bases, also known as ampholytes, into immobilized pH gradient (IPG) gels.
IPGs are the acrylamide gel matrix polymerized along with the pH gradient and give rise to completely stable gradients. They exceptionally lose stability at most alkaline pH values (pH>12).
When a mixture of proteins is applied in the gel, each protein migrates up to the pH unless it is equal to its isoelectric point (Figure 2). A protein that is present in a pH region below its isoelectric point is positively charged. Thus, it starts migrating towards the cathode.
So, migrating through an increasing pH gradient, when the protein reaches the pH region similar to its isoelectric point, the overall charge of the protein is decreased. At this point, the protein is devoid of any charge, and thus, it stops further migration.
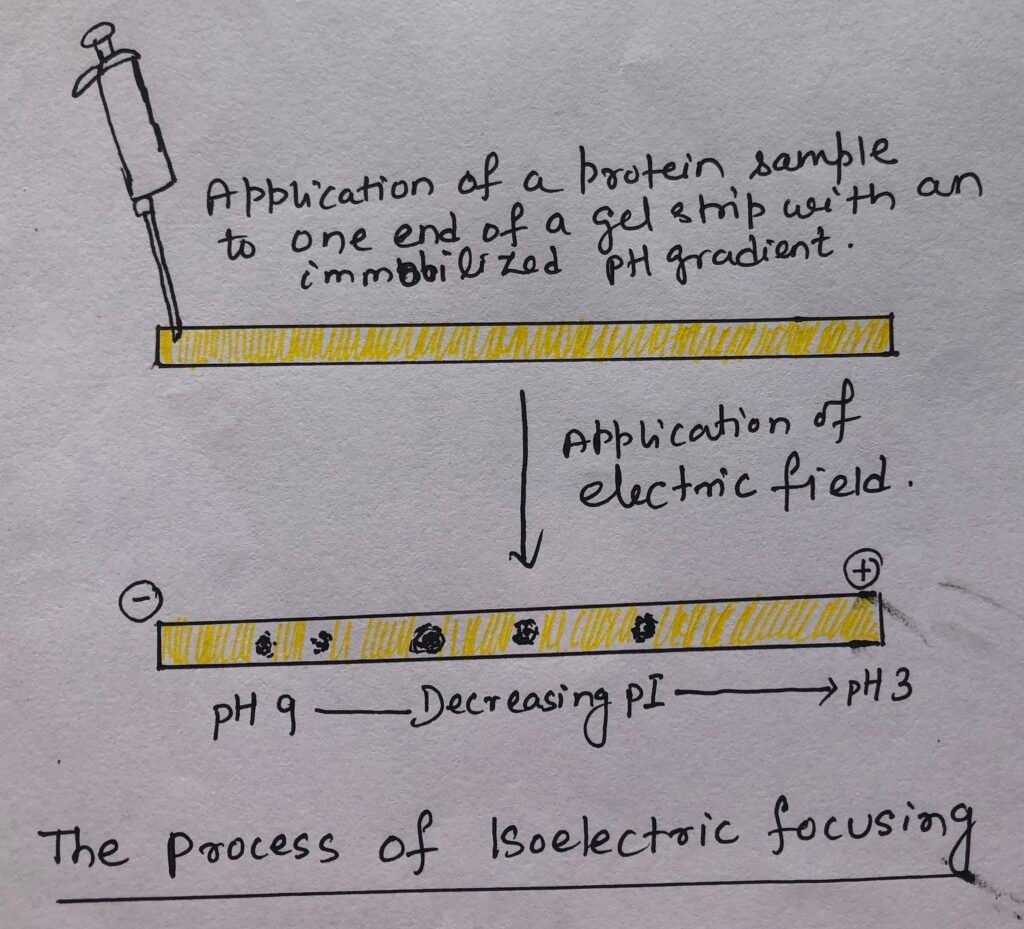
In this manner, the proteins can be observed with sharp, stationary bands. Each protein is marked at a point in the pH gradient, corresponding to its isoelectric point. Thus, the proteins with different isoelectric points (IPs) are distributed differently throughout the gel.
Two-Dimensional Electrophoresis
Two-dimensional electrophoresis is a sequential combined process of isoelectric focusing. The SDS gel electrophoresis, a more sensitive analytical method, allows the resolution of a complex mixture of proteins. The process separates proteins of similar molecular weights but differs in their isoelectric point (pI). The process may separate proteins with identical pI values but differ in their molecular weights.
The method separates proteins according to their isoelectric points. A mixture of proteins is placed on a gel strip, which contains an immobilized pH gradient. When an electric field is applied, proteins get inside the gel and migrate up to the point where pH is equivalent to each protein’s isoelectric point (pI). When pH is equivalent to pI, the protein is devoid of charge, or the net charge of the protein is zero.
Protein Purification is Related to Specific Activity
To purify a specific protein, the protein needs to be detected and quantified in the presence of other proteins during every step of the purification process.
The amount of enzymatic proteins in a given solution or tissue extract depends upon the catalytic effect of the enzyme, which can be measured by the increased rate at which the substrate is converted into products in the presence of the enzyme.
Internationally, it is recommended for most of the enzymes that 1.0 unit of enzyme activity denotes the amount of enzyme transformed 1.0µmol of the substrate to the product in one minute at 25ºC temperature.
The Terms Specific activity and Activity
The total units of enzyme in a solution is termed as the activity. The specific activity can be defined as the number of enzyme units per milligram of total protein. During the purification of an enzyme, the specific activity increases. It is maximum and constant when the enzyme is pure. Thus, it is a measure of an enzyme’s purity.
The activity of the preparation is analyzed after each step of protein purification. The ratio of the total amount of protein to the activity denotes the specific activity. Both the activity and the total protein amount decrease with each step of the purification process.
The decrease in value is due to the non-ideal interactions with other molecules in the solution or may be due to inactivation, which leads to decreased activity. As many unwanted proteins needed to be removed in each step resulted in a decrease in the amount of total protein.
In a useful step, the loss of activity is much less than the loss of non-specific protein, which leads to an increase in specific activity with a decrease in the total activity of proteins. The protein is considered to be pure when specific activity isn’t increased further in subsequent purification steps, and a single protein species can be detected.
Comparison Between Activity and Specific Activity
The difference between activity and specific activity can be understood as it is illustrated in the figure (Figure 3) below. In the two beakers, the presence of colorful beads can be seen.
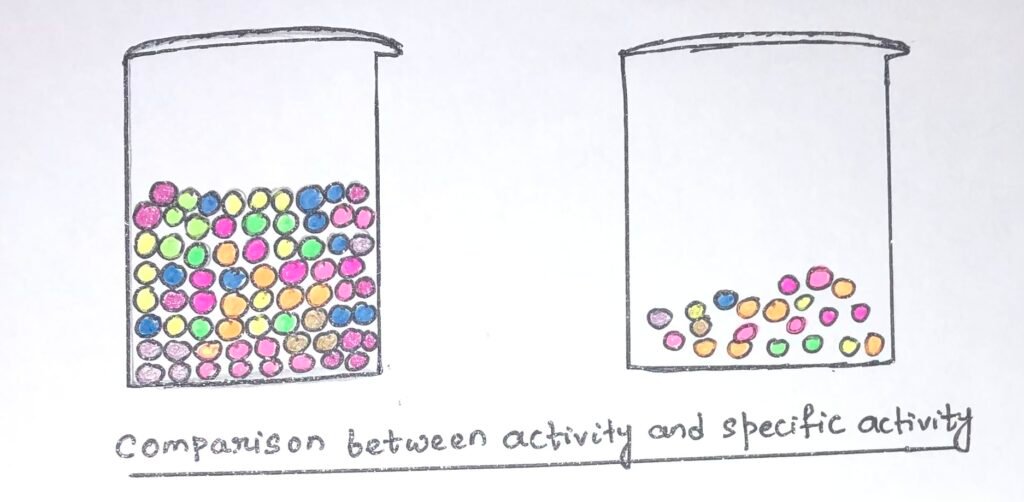
The two beakers contain the same number of orange beads but different colors of other beads. If we consider the beads as proteins, then it can be seen that both beakers contain the same activity of the protein, represented by the orange beads. In the first beaker, the amount of total protein is much higher than in the second one. In the second beaker, the specific activity is higher as the orange beads represent a higher fraction of the total protein.
Conclusion
In the process of electrophoresis, charged proteins can be separated based on their migration in an electric field. The movement of a protein in an electrophoretic gel is a function of its size and shape. The variation in gel electrophoresis includes SDS-PAGE, affinity electrophoresis, immuno-electrophoresis, capillary electrophoresis, etc.
Isoelectric focusing is used to determine the isoelectric point of a protein. Two-dimensional electrophoresis is a sequentially combined process of isoelectric focusing and SDS gel electrophoresis.
The specific activity increases during the enzyme purification process, and when the enzyme is pure, the value of specific activity is maximum and constant.
You may also like:
- Peptides and proteins with their distinguishing properties
- Deciphering Protein Function through Analysis of Protein–Protein Interactions

I, Swagatika Sahu (author of this website), have done my master’s in Biotechnology. I have around fourteen years of experience in writing and believe that writing is a great way to share knowledge. I hope the articles on the website will help users in enhancing their intellect in Biotechnology.