


In this article, I briefly describe quantitative cell analysis using flow cytometry.
Flow Cytometry
Flow cytometry, first developed in the early 1980s by Leonore Herzenberg and colleagues, quickly emerged as a powerful analytical tool in cell biology and immunology. One of its earliest and most significant applications was the analysis of lymphocyte subpopulations in patients with HIV infections, which highlighted its clinical value. The technique is based on labeling cells with fluorescent antibodies or probes, allowing researchers to measure the frequency of specific cell types with high precision. In addition to fluorescence detection, flow cytometry also provides valuable information on cell size and internal complexity through forward and side light scattering, making it a versatile method for both research and diagnostic purposes.
Light Scattering in Flow Cytometry
Flow cytometers analyze cells by detecting the light they scatter when illuminated by a laser beam. Forward scatter, which occurs in the same direction as the incoming laser, gives an approximate indication of a cell’s size. In contrast, side scatter—measured at a right angle to the laser—reveals details about internal structures such as the endoplasmic reticulum and intracellular vesicles. Together, these scattering patterns provide insights into both the size and internal complexity of cells, and when combined with fluorescence signals, they enable a comprehensive characterization of cell populations.

Fluorescence-Activated Cell Sorter
When a flow cytometer is equipped to separate cell subpopulations based on their fluorescence and light-scattering profiles, it is known as a fluorescence-activated cell sorter (FACS). In this system, cells displaying the desired combination of markers are given an electrical charge, allowing them to be deflected into designated collection tubes for further study. The development of FACS occurred alongside the advancement of monoclonal antibody technology, and together these innovations greatly enhanced the power of flow cytometry. As more monoclonal antibodies became available for cell identification, flow cytometric analysis and sorting became increasingly precise and informative.
From Simple Fluorescence to Multiparameter Flow Cytometry
In fluorescence microscopy, the samples remain fixed. This allows researchers to study detailed features of a relatively small number of cells. Flow cytometry, by contrast, is designed to analyze vast populations—hundreds of thousands to millions of cells. They rapidly pass through a laser beam, making it possible to determine the frequencies of distinct subpopulations within a sample. Early applications were relatively simple, often relying on just two antibodies labeled with red and green fluorochromes to distinguish CD4⁺ and CD8⁺ T cells in the blood of patients suspected of HIV infection. Modern flow cytometers, however, are far more advanced, capable of assessing 20 or more parameters per cell by combining multiple lasers with diverse fluorescent tags, enabling a highly detailed and multidimensional view of cell populations.
Technical Challenges and Instrumentation Advances in Flow Cytometry
Designing instruments that can capture and integrate both fluorescence and light-scattering data from individual cells moving past a laser beam involves highly sophisticated engineering. Modern flow cytometers require advanced hardware and powerful software to manage this complexity. Despite these challenges, contemporary systems are equipped with user-friendly interfaces, enabling skilled immunologists to efficiently extract valuable biological insights from the cell populations under investigation.
Optical and Fluidic Systems in Flow Cytometry
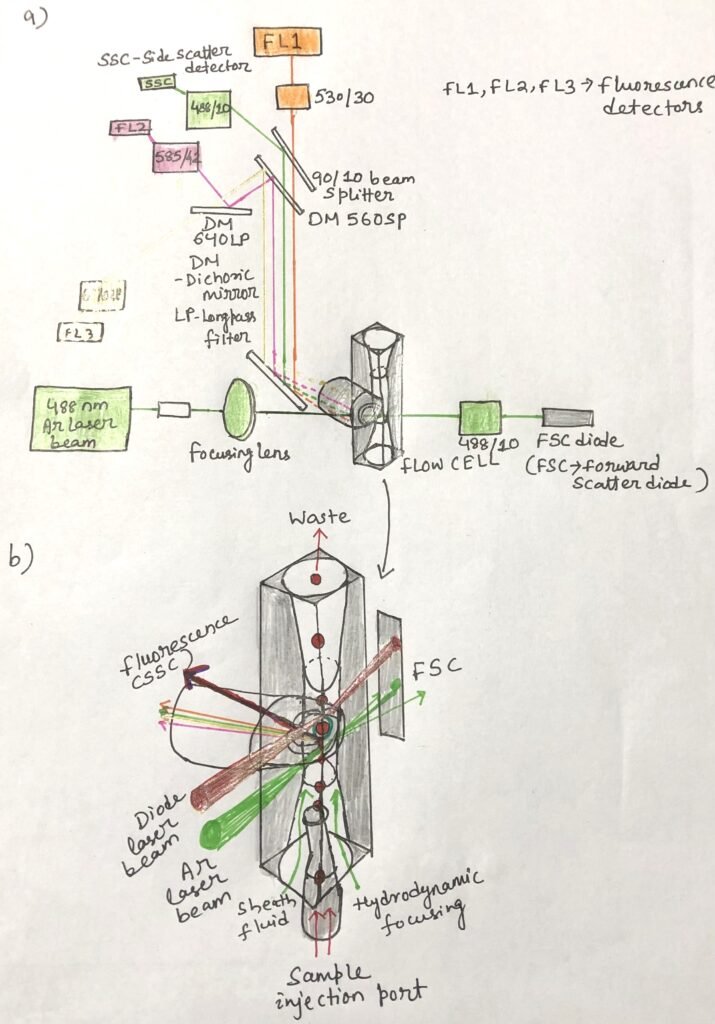
The flow cytometer provides fluorescence excitation with the help of laser beams. It also employs multiple detectors to capture both scattered light and emitted fluorescent signals from individual cells as they pass through a focused stream of light. Early instruments relied on a single argon laser (Figure 1 ( a)) producing a strong 488 nm beam. In contrast, modern cytometers are equipped with multiple lasers capable of providing eight or more excitation wavelengths.
In a typical setup, cells suspended in fluid are introduced through the sample injection port (SIP) (Figure 1(b)). Here, a rapidly flowing saline sheath surrounds the narrow stream of cells, guiding them so that they move in single file across the laser beam. This process, known as hydrodynamic focusing, ensures precise analysis by directing one cell at a time through the detection zone.
Light Scattering and Fluorescence Detection
Each time a cell crosses the laser beam, part of the light is scattered without any change in wavelength. In addition, some of the incident light excites fluorescent dyes bound to the cell surface or present inside the cytoplasm, causing them to emit light at wavelengths specific to each dye. The information recorded from these interactions for every individual cell is stored as list mode data.
As a cell moves through a laser beam, most of the light it scatters is directed forward, within about 5 to 10 degrees of the laser path. This forward scatter is detected by a photodiode, a relatively low-sensitivity sensor that is ideal for this measurement. Since larger cells scatter more light in the forward direction, the intensity of forward scatter (FSC) serves as an indicator of cell size.
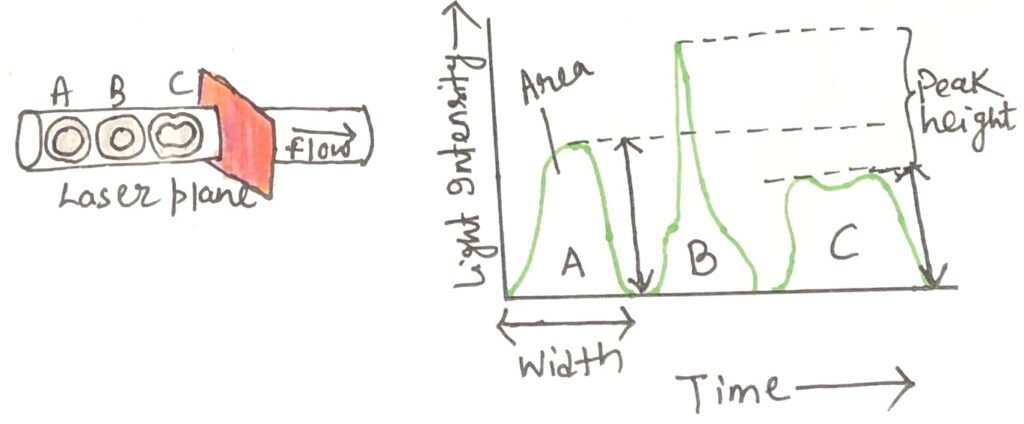
In contrast, other detectors in flow cytometers rely on highly sensitive photomultiplier tubes (PMTs), which generate and record electron pulses in response to light signals. These pulses—characterized by their height (H), width (W), and area (A)—are digitized and stored by the instrument (Figure 2). A second detector, positioned at approximately 90 degrees to the laser path, measures side scatter (SSC). The amount of side scatter reflects the internal complexity of the cell; greater numbers of intracellular structures, such as endoplasmic reticulum and mitochondria, result in higher SSC values.
Application of Flow Cytometry
Flow cytometry has wide-ranging applications in both clinical diagnostics and research. It is routinely used for immunophenotyping of blood cells, monitoring immune status in HIV patients, detecting minimal residual disease in leukemia, and evaluating cell cycle or apoptosis in experimental studies. Additionally, it plays a crucial role in vaccine development, stem cell research, and transplantation medicine. One of the most illustrative and widely used applications is the analysis of human peripheral blood, where forward and side scatter plots help distinguish different immune cell populations.
Interpreting FSC vs. SSC Plots in Peripheral Blood
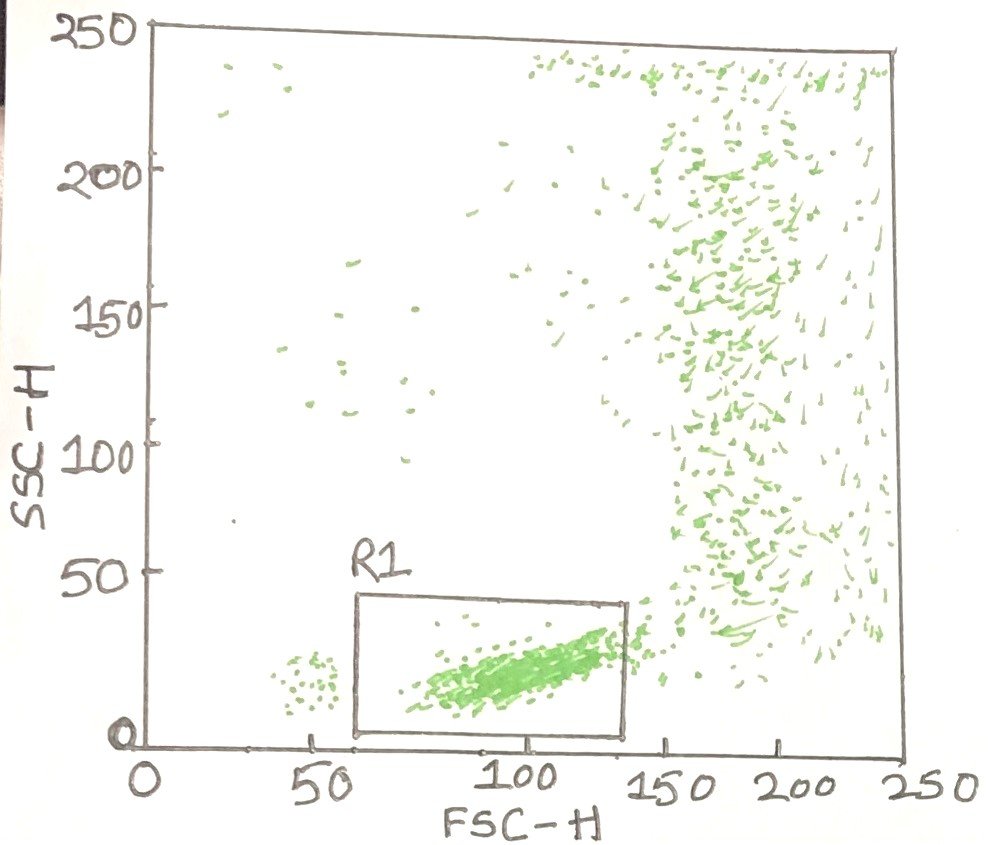
Neutrophils are distinguished by high forward and side scatter and can therefore be found high and to the right on an FSC-to-SSC scatter plot (Figure 3). In contrast, unactivated lymphocytes, which are small and do not have many internal membranes, are found at the low, left-hand side of the scatter plot. Flow cytometric software can draw a “gate” around any population the investigator wishes to analyze.
Multiparameter Fluorescence Analysis
Fluorescent dyes attached to antibodies that bind specific cell surface antigens are excited by the laser in a flow cytometer. The emitted fluorescence is captured by photomultiplier tubes (PMTs) positioned at right angles to the laser path. This reduces interference from intense forward scatter. Each PMT is preceded by a system of mirrors and filters (Figure 1a) that restricts detection to a defined wavelength range.
As cells pass one by one through the laser beam, the instrument records fluorescence intensities at multiple wavelengths along with forward and side scatter values. It stores this information in a detailed list mode file. With continuous technological advances, modern flow cytometers can now measure as many as 20 fluorescence and light-scattering parameters per cell. Thus, greatly expanding their utility in both research and clinical settings.

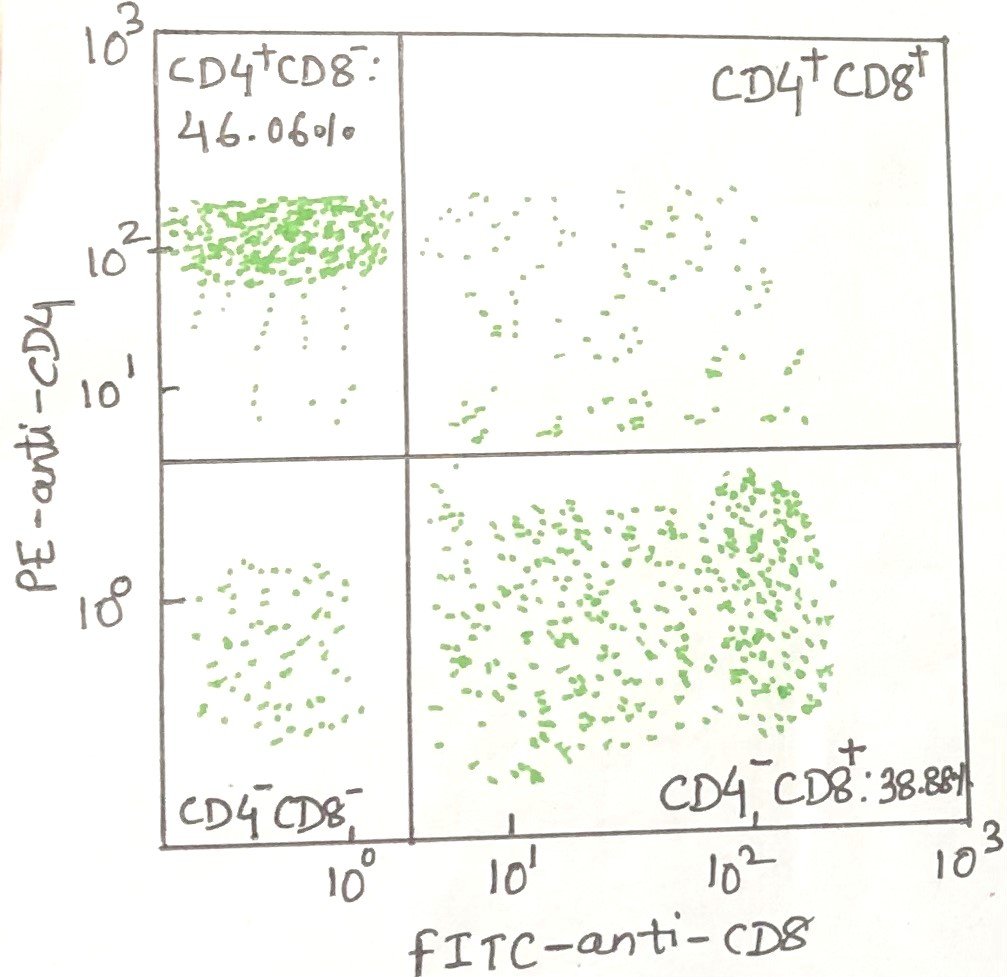
From the FSC versus SSC plot, a representative fluorescence profile can be generated for cells gated within the lymphocyte region (R1) (Figure 3). In this example, the cells were labeled with a fluorescein-conjugated anti-CD8 antibody (FITC–anti-CD8). Fluorescein isothiocyanate (FITC) is a dye commonly used to form antibody–dye conjugates⁺. T cells, therefore, emit green fluorescence. This green signal is detected in the FL1 channel of the flow cytometer. The fluorescence intensity of each cell is displayed along the x-axis (abscissa) of the resulting graph (Figure 4).
Conclusion
Flow cytometry has evolved from a simple fluorescence-based technique into a highly advanced tool capable of multiparameter analysis of millions of cells. By integrating light-scattering properties with fluorescence detection, it provides powerful insights into cell size, structure, and function. Its applications range from basic research in immunology to sophisticated clinical diagnostics. Thus, makes it an indispensable technology in modern biology and medicine.
You may also like:
- Conventional Imaging Techniques Based on Immunofluorescence
- The Antigen-Antibody Interaction- Immunofluorescence

I, Swagatika Sahu (author of this website), have done my master’s in Biotechnology. I have around fourteen years of experience in writing and believe that writing is a great way to share knowledge. I hope the articles on the website will help users in enhancing their intellect in Biotechnology.